If you remember our latest article, you already know how excited we are about the capabilities of Google Data Studio (GDS). We find this tool to be a perfect solution for all those who want to transform complex analytics metrics, social media stats and other information into completely personalised (and also beautiful ;) as well as easily understandable reports that focus on the main aspects of their online success. But in order for GDS to work its magic and really turn analytics data into attractive graphs, pie charts and other visualisation aids, one doesn’t only need quite a bit of knowledge but also some experience. It is for this reason that it’s best to leave the configuration of Google Data Studio reports to seasoned analytics professionals. And with our team by your side, this process is a piece of cake. Read on to find out more about how we can help you create your very own GDS report.
How we Create a Personalised Google Data Studio Report in just 4 Steps
Because making something simple isn’t always … simple
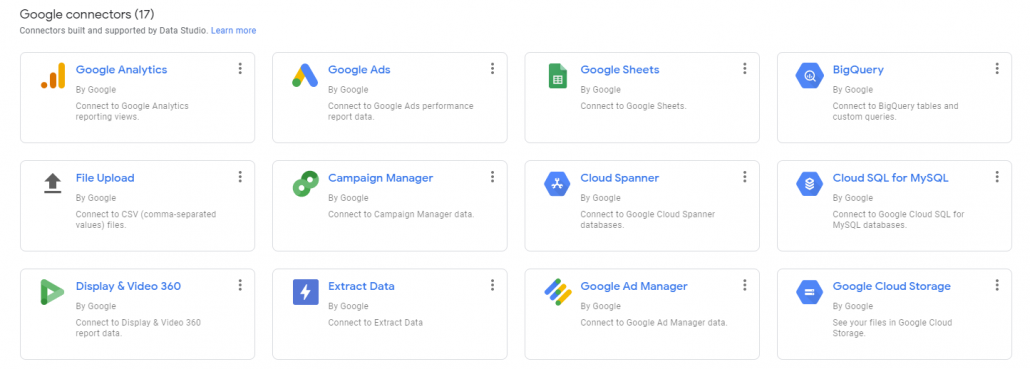
Google Data Studio does not track your online achievements on its own, collecting the data from different sources (analytics and advertising tools, social networks, various databases etc.) instead and bringing all their insights together in a single report. However, for this powerful solution to work, all the processes in the background need to work too. This means that all the analytics tools and other data sources included in the reporting process need to be configured properly in order to provide accurate information.
Especially in the case of businesses that haven’t yet established a structured system of measuring their online success, configuring a personalised Google Data Studio report is not a completely straightforward process. However, this doesn’t necessarily mean that embarking on an analytics journey without previous experience will inevitably result in tons of work and even more stress. Actually, you can easily avoid all the fuss by joining forces with specialists that can take over the configuration part for you. At Optiweb, we create each unique GDS report for our clients in four easy steps.
1. Kickoff meeting and analysis
The key to a quality GDS report is in thoroughly analysing the client, their requirements and needs. Therefore, we first need to know who will actually be checking the report. Is it the business owner themselves or is it their marketing manager, social media strategist, advertiser or even a sales representative? Or will it serve all these individuals at the same time?
And why does this matter so much? In general, people within the management structures of a business aren’t interested in specific details but only need the most crucial bits of information. They need to know how high the monthly income is or how much money the company has spent on advertising. On the other hand, employees in the digital marketing departments need a more detailed insight into the metrics to zero in on specific details, such as the success of individual advertising or social media campaigns, the rankins of the site in Google’s search results or the information on the subpages with the most organic traffic.
To meet all the different needs of your personnel, we often split the data into several sheets that focus on different aspects of a client’s online business. Thus, one part of the report can focus entirely on the finances while other parts can be all about the metrics relating to their respective means of digital promotion.
However, the central part of the first step is getting to know your business niche, your business goals as well as the scope of digital marketing activities you are already carrying out. This way, we can determine which metrics are the most relevant to your business and how we could best monitor them. Is your goal improving the organic traffic to your site or do consider online advertising your strongest marketing asset? Do you mostly promote your product or services through social media?
In the first case, we will focus on collecting the data relating to your online traffic, such as the number of users and sessions, traffic sources, main keywords or conversions. And in the second case, we’ll fill the report with the metrics displaying the success of your advertising campaigns (like impressions, clicks, reach and the money spent). And we won’t let down those that want to impress their followers with creative Facebook or Instagram posts either, providing them with a report including all the most important social media stats for their respective profiles.
What really matters is that a Google Data Studio report is truly YOURS. This doesn’t only mean that we create and configure it for you, but also that each of its parts is completely tailored to your needs and activities. Only in this way can we get rid of the all the ballast and help you to focus on what really drives your business forward.
2. The measurement plan
Once we have thoroughly analysed your business needs as well as the activities of your online competition, we can start working on the actual report. In this phase, we determine exactly which metrics need to be included in it and choose the data sources that will provide it.
Together with you, we check which analytics tools and data sources you are already using and how we can include their insights in the final report. Based on this, we propose an additional list of sources that you might want to use to get the information you need most.
The choice of data sources that can provide insights on your online presence to a personalised Google Data Studio report is growing constantly and already includes all of the most popular digital marketing tools and social media platforms while also allowing for the integration of specific databases. However, if you are not sure whether a particular aspect of your business can be effectively measured and presented in the report, you can always get in touch with us or leave us a question in the comments. We’ll be happy to help you out!
3. Configuring and connecting data sources
Once we know what exactly we will track with your personalised GDS report, it’s time for a crucial, albeit often overlooked step: checking the configuration of your data sources. Are the tools that your report will rely on properly configured or do they need some extra tweaking by our specialists? In order to start putting the actual report together, it’s crucial that everything has been set up in the right way. For this reason, our team usually checks if your existing or newly implemented analytics tools provide reliable data and function without problems, helping you out with additional settings if needed.
In most cases, a client’s Google Analytics account shows no signs of tracking issues. However, when it comes to configuring event goals in order to track KPIs, many clients need some professional support. At Optiweb, we usually set up goal tracking using Google Tag Manager.
4. Finishing the report
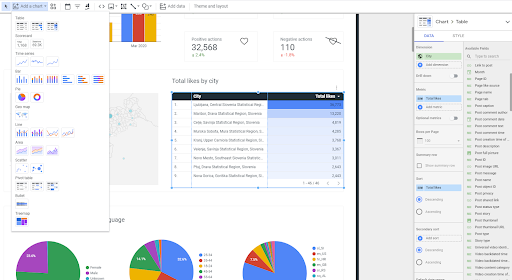
We are finally ready to start bringing metrics to life. Now is the time to choose the most appropriate types of graphs, charts, tables and funnels to present your data. The design possibilities are practically endless and we can personalise the report using visual materials and colours of your choice. We can also equip the report with short explanations of certain metrics and guidelines on how to read and interpret them correctly, making sure that the document is even easier to read and that none of your colleagues will depend on external help to properly understand the results.
And the best part: we can tailor the graphic elements of your Google Data Studio to match your brand identity. This way, we create a truly unique document with your logos and company colours, making sure it blends in with all the other documents you use on a regular basis. Therefore, you can forget about extracting the data or charts and inserting them in other documents as your report is always ready to be shared, either with your colleagues or with your investors and business partners (once you grant them access). And they can access it from any device and literally from anywhere.
Time to step up your analytics game
A personalised Google Data Studio report can give your digital marketing efforts an immense boost. Even if you are a seasoned veteran when it comes to analytics, GDS can help you be even more efficient and proactive when taking new business decisions; since the vital information on your online performance will always be just a click away, you won’t need to lose time for lengthy analyses or manually checking different sources for data. On the other hand, those who have just started their online business or have little analytic experience will be a lot more confident when making their first steps while greatly improving their chances of success.
Let the power of data really help you
Do you want to keep an eye on your online presence and work even harder to achieve the digital goals you’ve been pursuing for so long? Awesome! You know where you want to go and we can help you out by visualising the data you need to get there. Let’s meet over a virtual coffee to get to know each other and make the perfect plan to get you going.


